Platform reliability is not a state you reach — it is an ongoing operational practice. Gigamatics delivers SRE-principled managed operations across your platform stack: proactive performance monitoring, SLO governance, capacity planning, incident coordination, and observability engineering — so your engineering teams ship product, not incidents.
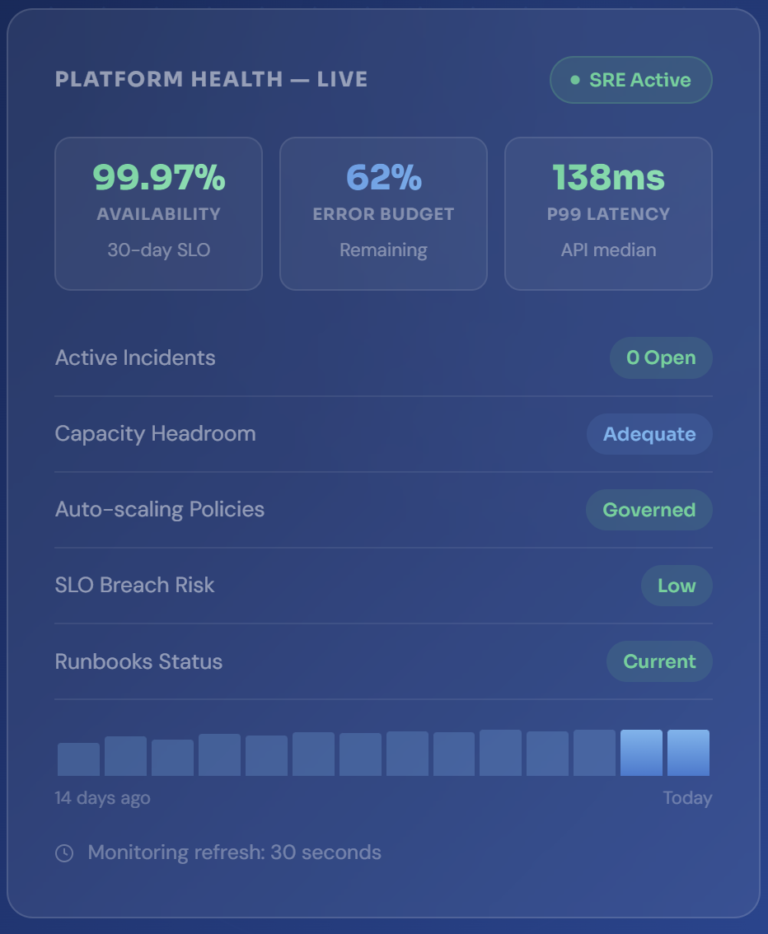
Nine structured operational pillars — each documented, governed, and calibrated to your platform architecture,
SLO targets, and engineering team’s working model.
Continuous monitoring of platform performance metrics — latency, throughput, error rates, saturation, and availability — with threshold-based and anomaly-driven alerting designed to detect degradation before users do.
Define, instrument, and continuously track Service Level Objectives against your platform commitments — with error budget accounting that gives engineering teams clear, data-driven signals on when to ship features and when to prioritise reliability work.
Forward-looking capacity analysis that translates growth projections and traffic patterns into infrastructure provisioning recommendations — preventing both performance-degrading under-provisioning and cost-wasting over-provisioning.
Structured incident response with defined severity classification, response SLAs, and a named senior SRE who coordinates containment, communication, and resolution — and owns the post-incident review to ensure learning is captured and acted on.
Structured diagnostic analysis of infrastructure health across compute, networking, storage, and platform services — identifying performance bottlenecks, misconfigured components, and architectural inefficiencies that degrade reliability over time.
Design, implementation, and ongoing governance of auto-scaling policies across compute, Kubernetes workloads, and managed services — ensuring scaling behaviour is predictable, cost-efficient, and calibrated to actual traffic patterns rather than defaults.
Beyond reactive operations, we continuously analyse your platform for structural reliability improvements — identifying architectural changes, configuration optimisations, and process improvements that reduce operational risk and engineering overhead over time.
Structured review and continuous improvement of your observability stack — ensuring that metrics, logs, and traces are correctly instrumented, efficiently collected, and actually used to inform reliability decisions rather than simply accumulating in dashboards nobody reads.
Continuous maintenance of operational runbooks, incident playbooks, and platform knowledge documentation — ensuring that every operational procedure is current, tested, and accessible to both the Gigamatics SRE team and your own engineering team when needed.
Most organisations treat reliability as a reactive discipline — scrambling when things break. Gigamatics applies SRE principles to managed operations: structured measurement, proactive intervention, and continuous improvement as an ongoing practice rather than a periodic audit.Gigamatics Managed Security & Compliance Operations is not a reactive alert-forwarding service. It is a proactive, structured practice — built on senior security engineers, defined SLAs, and governance frameworks that keep your organisation genuinely protected and audit-ready at all times.
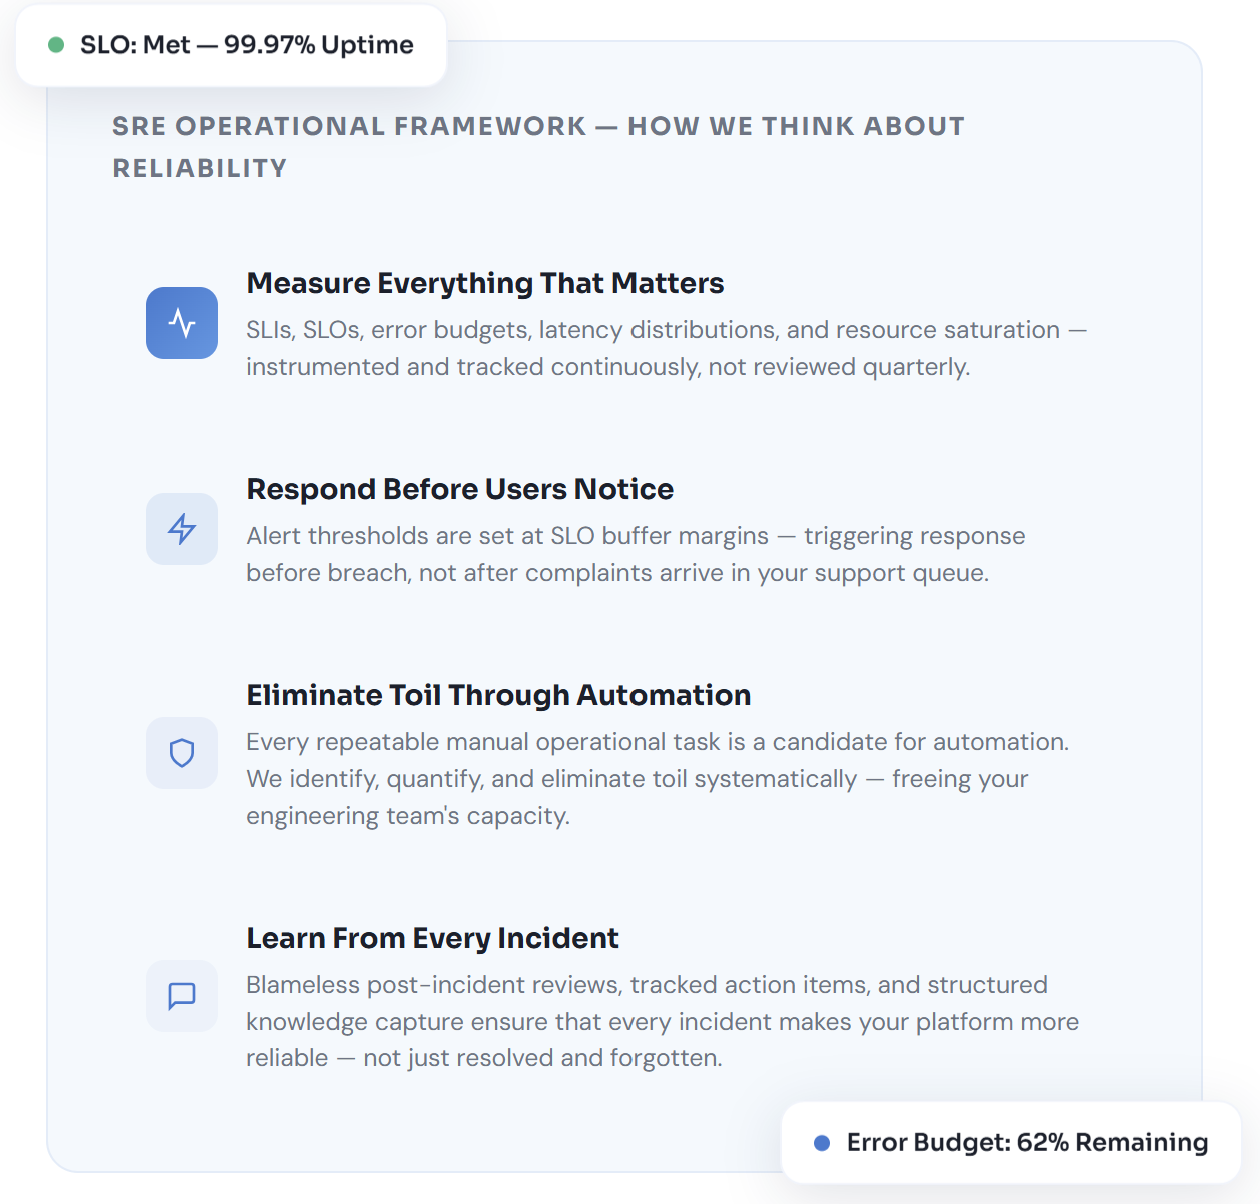
We move your reliability conversation from vague "five-nines" aspirations to precisely defined, measured, and actioned Service Level Objectives that reflect what users actually experience.
Error budget management gives engineering leadership a quantitative framework for balancing reliability investment against feature velocity — ending arbitrary deployment freezes and unresolved reliability debt.
Capacity forecasting, alert calibration, and operational improvement recommendations shift the team's orientation from responding to incidents to preventing them — reducing the operational burden on your engineering organisation over time.
Every Gigamatics managed reliability engagement begins with a structured onboarding phase that establishes the SLO framework, observability baseline, and operational runbooks — before continuous monitoring and operations go live with defined SLAs.
Your platform is owned by a named senior reliability engineer who understands your architecture, traffic patterns, and SLO targets — not a rotating on-call pool responding to alerts without context.
Onboarding establishes the SLI and SLO definitions, observability coverage audit, alert calibration, and runbook documentation before monitoring operations begin — so the service launches on a solid foundation, not retrofitted later.
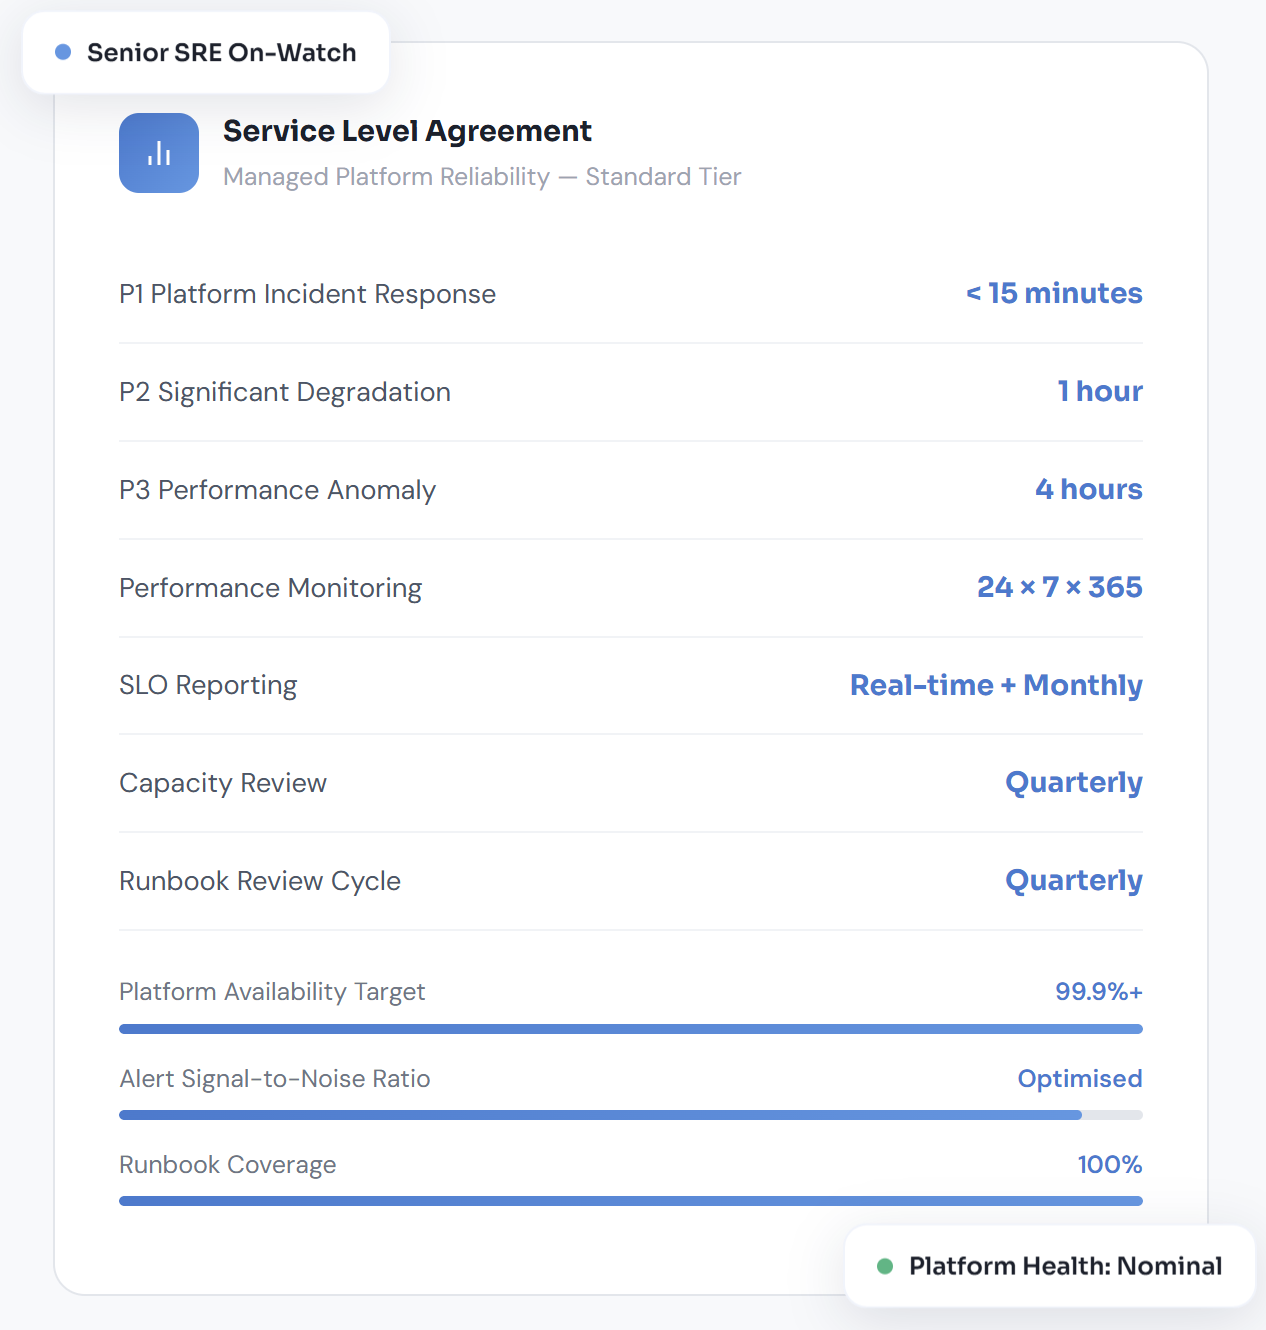
P1 incident response within 15 minutes, SLO monitoring 24×7, and monthly performance reporting are contractually defined — with SLA attainment data delivered to your engineering leadership each month.
A structured monthly report covering SLO attainment, error budget consumption, incident summary, capacity status, observability health, and operational improvement recommendations — formatted for both engineering and executive audiences.
Operational improvement recommendations, runbook updates, alert recalibration, and architecture observations are delivered monthly — ensuring your platform's reliability posture improves consistently over the life of the engagement, not just at the start.
We engineer and operate observability stacks that give your team genuine signal — not a wall of dashboards and an alert queue nobody trusts. Our managed observability practice covers instrumentation, collection, storage, visualisation, and continuous signal quality improvement.
Prometheus, Datadog, New Relic, Dynatrace, CloudWatch — configured, maintained, and continuously optimised for signal quality, retention efficiency, and cost governance.
ELK Stack, Loki, Splunk, Datadog Logs — structured log pipeline design, index management, query optimisation, and alerting integration across application and infrastructure layers.
kube-state-metrics, cAdvisor, OpenTelemetry Collector, Pixie — full visibility into node health, pod resource consumption, HPA scaling events, and control plane stability across EKS, AKS, and GKE environments.
Jaeger, Tempo, Datadog APM, AWS X-Ray — trace instrumentation, service map maintenance, latency bottleneck investigation, and cross-service dependency visibility for microservices and Kubernetes environments.
Grafana, Kibana, Datadog dashboards — maintained SLO dashboards, capacity views, incident command screens, and executive-level reliability scorecards designed for actual use rather than initial configuration and neglect.
PagerDuty, OpsGenie, Alertmanager — alert routing, escalation policy design, on-call schedule management, and alert fatigue reduction through threshold tuning and deduplication at the routing layer.
Every reliability operation runs on a defined, documented schedule. Nothing is left to ad-hoc discretion — every activity has an owner, a cadence, and a documented output.
|
Activity
|
Description
|
Cadence
|
|---|---|---|
|
Platform Performance Monitoring
|
Continuous collection and analysis of platform metrics — availability, latency, throughput, error rate, and resource saturation — with immediate alerting on threshold breach or anomaly detection.
|
Continuous
|
|
SLO Compliance Tracking
|
Real-time SLO attainment measurement against defined targets — with error budget burn rate monitoring and proactive alerting when burn rate indicates breach risk ahead of the SLO window closing.
|
Continuous
|
|
Auto-Scaling Policy Monitoring
|
Continuous oversight of scaling behaviour across compute and Kubernetes workloads — confirming that scaling events trigger correctly, complete successfully, and do not cause performance or cost anomalies.
|
Continuous
|
|
Incident Detection & Response
|
Alert triage, severity classification, and coordinated response — P1 incidents acknowledged within 15 minutes, with named SRE ownership of containment, stakeholder communication, and resolution from detection to closure.
|
Continuous
|
|
Performance Trend Analysis
|
Weekly structured review of performance metric trends — identifying gradual degradation, resource saturation trajectories, and emerging bottlenecks that do not yet trigger alerts but indicate future reliability risk.
|
Weekly
|
|
Alert Threshold Review
|
Review and recalibration of alert thresholds based on recent incident data, traffic pattern changes, and false-positive rates — maintaining signal quality as the platform and its traffic profile evolve.
|
Weekly
|
|
Post-Incident Review (RCA)
|
Blameless root cause analysis for every P1 or P2 incident — documenting cause, timeline, contributing factors, response actions, and preventive recommendations. Delivered within five business days of incident resolution.
|
Post-Incident
|
|
Observability Stack Review
|
Monthly review of observability coverage, dashboard utility, metric cardinality, log retention efficiency, and trace sampling rates — with optimisation recommendations to improve signal quality and reduce tooling cost.
|
Monthly
|
|
Operational Improvement Report
|
Monthly register of identified reliability improvement opportunities — covering architecture gaps, toil candidates, SLO improvements, and scaling policy refinements — with priority scores and implementation guidance.
|
Monthly
|
|
Monthly SRE Performance Report
|
Structured monthly report covering SLO attainment, error budget consumption, incident summary, capacity status, observability health, and improvement actions — delivered to engineering and leadership audiences.
|
Monthly
|
|
Capacity Planning Review
|
Quarterly capacity analysis — reviewing utilisation trends against growth projections, headroom adequacy across environments, and scaling policy calibration — with documented provisioning recommendations and cost impact estimates.
|
Quarterly
|
|
Runbook & Knowledge Base Review
|
Quarterly review and validation of all operational runbooks, incident playbooks, and platform documentation — confirming accuracy against current platform state and updating procedures where the environment has changed.
|
Quarterly
|
Most managed monitoring services forward alerts and wait for your team to respond. Gigamatics applies real SRE principles.
SLO-driven operations, structured capacity planning, and continuous improvement
to keep your platform reliable and your engineering team focused on product.
Your platform is operated by engineers who have designed distributed systems, built SLO frameworks, and managed Kubernetes clusters at scale — not a monitoring centre running generic playbooks without platform context.
We move the reliability conversation from five-nines promises to precise, measured SLOs with error budgets — giving your engineering and product leadership a shared, quantitative framework for reliability investment decisions.
Monthly operational improvement recommendations, runbook updates, and observability optimisations mean your platform’s reliability posture improves continuously over the engagement — not just during the first month of onboarding.
Knowledge transfer, runbook documentation, and observability improvements are built into the service — so your engineering team gains capability from the engagement rather than becoming dependent on external support to understand their own platform.
Consistent, validated reliability and performance outcomes across platform
teams of varying scale, architecture, and maturity.
Organisations that move from ad-hoc uptime monitoring to structured SLO governance consistently achieve and sustain higher availability targets — because reliability is explicitly measured, managed, and invested in rather than hoped for.
Named SRE ownership, pre-built runbooks, and 24×7 monitoring mean that critical platform incidents are detected, acknowledged, and actively being contained within 15 minutes — before most users experience impact.
Continuous alert threshold tuning, false-positive analysis, and observability stack optimisation typically reduce alert volume by more than half within the first quarter — restoring your team’s trust in monitoring signals.
Pre-documented runbooks, structured incident coordination, and SREs with deep platform context reduce mean time to resolution by up to three times compared to organisations without managed reliability operations.
When reliability operations, monitoring management, and incident coordination are handled by a managed SRE team, your engineering organisation recovers the capacity to focus on product delivery — measurably improving development velocity.
Quarterly capacity planning reviews, resource utilisation trending, and proactive scaling governance eliminate the unplanned capacity crises that emerge when traffic outpaces infrastructure without a structured forecasting practice in place.
A structured conversation covering your current monitoring state, SLO maturity, incident patterns, capacity concerns, and where a managed SRE service would have the most immediate impact.
For qualifying engagements — a structured assessment of your observability coverage, alert quality, and SLO maturity, with a documented gap register and managed service scope recommendation
You speak with the engineer who would manage your platform — not a pre-sales representative. Every conversation is technically grounded, immediately relevant, and without obligation.
Have a specific question about your platform’s reliability posture, SLO framework, or what this service covers? Our SREs are ready to talk.
Many clients engage Gigamatics to augment existing SRE capability — providing additional coverage capacity, specialist Kubernetes expertise, SLO framework implementation, or dedicated observability engineering. We work alongside your team with clearly defined responsibilities and knowledge transfer built in.
Onboarding typically spans two to four weeks and covers four structured stages: observability coverage audit, SLO definition and instrumentation, alert calibration and runbook documentation, and a monitored go-live period where the SRE team operates alongside your existing team before taking full managed service ownership. We do not go live until the SLO framework, observability baseline, and runbook library are in place — so the service launches on a solid operational foundation.
Yes — and this is a common starting point. SLO definition and instrumentation workshops are a standard part of onboarding. We work with your engineering and product teams to identify the right SLIs for each service, define realistic and meaningful SLO targets, instrument the measurement, and then operate against them from day one. Most engagements begin without a formal SLO framework and develop one collaboratively during the onboarding phase.
Yes. We integrate with your existing observability stack — whether Datadog, Prometheus and Grafana, New Relic, Dynatrace, CloudWatch, or a combination. We assess your current tooling during onboarding and work within it — optimising configuration, alert quality, and dashboard utility rather than replacing tools unnecessarily. Where genuine tooling gaps exist, we recommend additions with clear justification and expected value.
Incident coordination covers detection, triage, severity classification, first-response containment, stakeholder communication, and post-incident review. For most platform-layer incidents, the Gigamatics SRE team leads from detection to resolution. For incidents that require application-level changes by your engineering team, we coordinate the response — managing communication and timeline while your team implements the fix. Scope of response is defined during onboarding based on your environment and team structure.
Capacity planning is delivered as a quarterly structured report — covering resource utilisation trends across compute, storage, and network layers, headroom analysis against defined thresholds, forecasts based on growth projections you provide, and prioritised provisioning recommendations with estimated cost impact. Between quarterly reviews, utilisation is monitored continuously and alerts fire if resources approach capacity thresholds ahead of the scheduled review cycle.
Yes. Kubernetes environment management is a core part of the service — covering cluster health monitoring, HPA and VPA configuration and tuning, node autoscaler governance, pod scheduling issue diagnostics, control plane health, and container resource right-sizing. We support EKS, AKS, GKE, and self-managed Kubernetes clusters, and have deep experience with service mesh environments including Istio and Linkerd.
Connect with our team to discuss your data, cloud, or security landscape and define a clear, structured path forward.
Testimonials
Pricing
Single Project
Single Prost
Portfolio